Introduction
This article provides an overview of specialized tools within the “Chrome” browser, called “DevTools”. Chrome DevTools are an irreplaceable set of tools intended for web developers to help them in their daily work. Through DevTools it is possible to view the HTML page and work with DOM elements, as well as access to all CSS properties of the elements.
In this toolkit, attention has been paid to the debugging part of JavaScript code. Using this tool, it is possible to define various ways of interrupting the execution of program code (the so-called breakpoint), which greatly facilitates the work of web developers when removing bugs on websites. At each interruption, an insight into the value of the variable as well as its areas of definition is enabled.
In addition to this, there are sections related to monitoring the performance of the web application, as well as an overview of the data exchange between the client and the server.
General
Global shortcuts
| Global Shortcut | Windows |
|---|---|
| Open whatever panel you used last | F12 or Control+Shift+I |
| Open the Console panel | Control+Shift+J |
| Show General Settings dialog | ?, F1 |
| Next panel | Ctrl + ] |
| Previous panel | Ctrl + [ |
| Backward in panel History | Ctrl + Alt + [ |
| Forward in panel history | Ctrl + Alt + ] |
| Change docking location | Ctrl + Shift + D |
| Open Device Mode | Ctrl + Shift + M |
| Open Command Menu | Ctrl + Shift + P |
| Toggle Console / close settings dialog when open | Esc |
| Refresh the page | F5, Ctrl + R |
| Refresh the page ignoring cached content | Ctrl + F5, Ctrl + Shift + R |
| Text search within current file or panel | Ctrl + F |
| Text search across all sources | Ctrl + Shift + F |
| Search files on page | Ctrl + P |
| Search functions within a file opened in the editor | Ctrl + Shift + O |
| Zoom in (while focused in DevTools) | Ctrl + + |
| Zoom out | Ctrl + - |
| Restore default text size | Ctrl + 0 |
Search all files
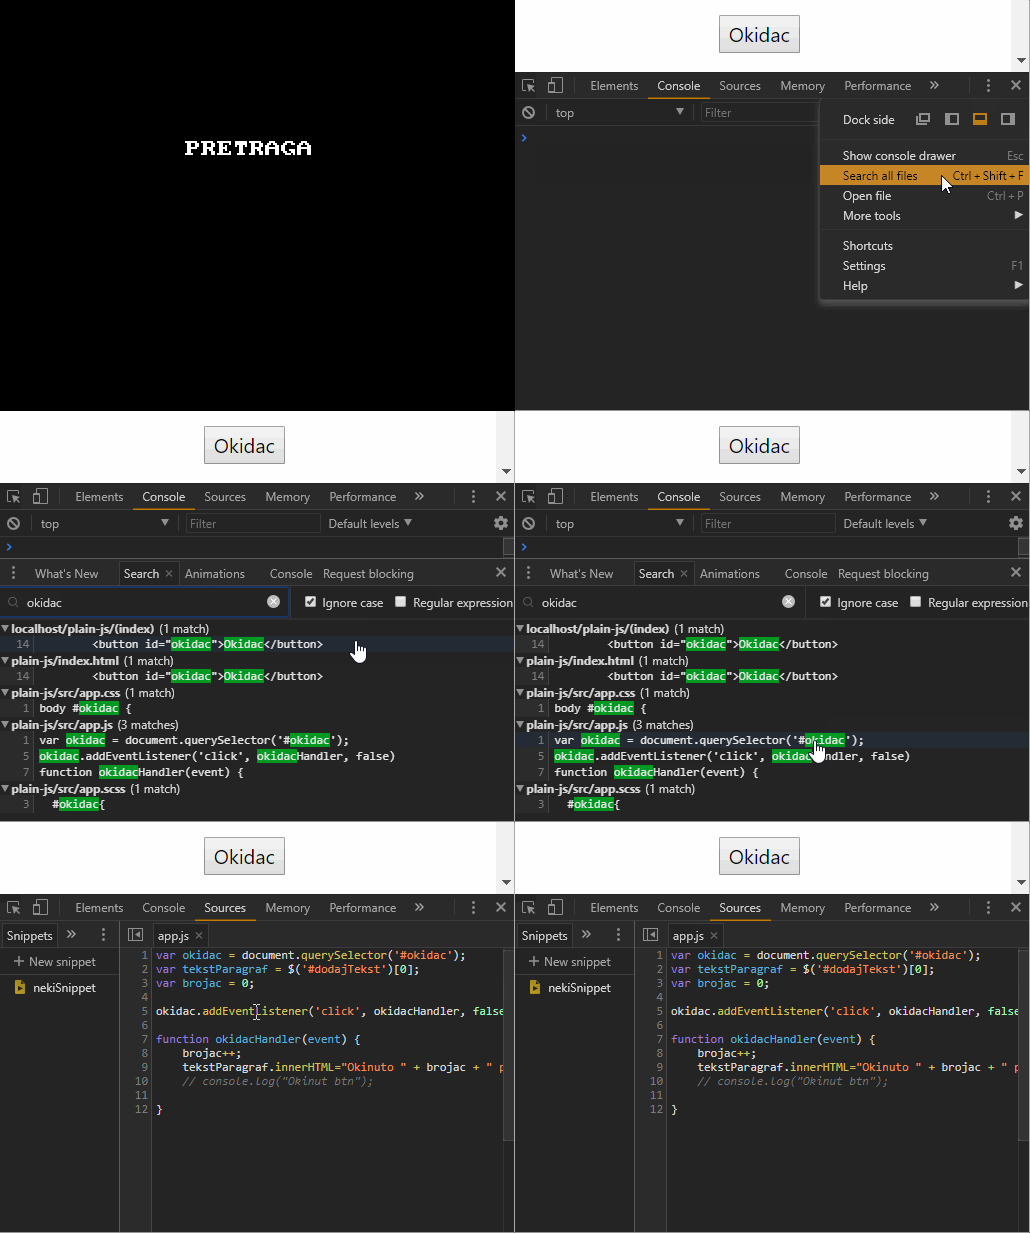
Search by keyword through all documents is enabled with the shortcut Ctr + Shift + F, after which the search section opens. After a search request by a keyword, the listed results appear in the section. Just click on one of the results and the corresponding file will open.
Inspector settings
Opening the settings window
The Settings window is most easily displayed with F1 or by clicking on the three vertical dots in the upper right corner of the inspector window.

Save code even after reload
If we want to save the code inside the console and after reloading the page, it is necessary to “check” the option “Preserve log upon” in the settings sectionnavigation” under the Console tab.
Blackboxing script
Blackboxing script is a procedure with which when debugging “step by step”, we can tell Chrom DevTools which files not to check, because probably the error is not there but in our files. The files that need to be inserted into the blackbox are usually third part libraries such as jQuery… When a file is put into the blackbox, then when “stepping into/out/over” the debugger will not stop on those files.
And way
It is necessary to open Chrom DevTools settings (F1) and select the Backboxing tab, after which you should write the name of the file or create a suitable Regex pattern.
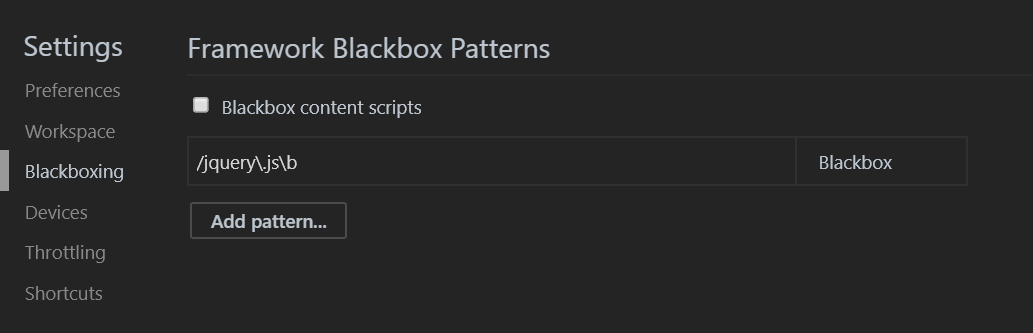
An example of frequently used patterns is:
- /jquery.js$
- .min.js$ — for all minified sources
- node_modules and bower_components — for dependencies
- ~ — home for dependencies in Webpack bundle
- bundle.js — it’s a bundle itself (we use sourcemaps, don’t we?)
- (webpack)-hot-middleware — HMR
II way
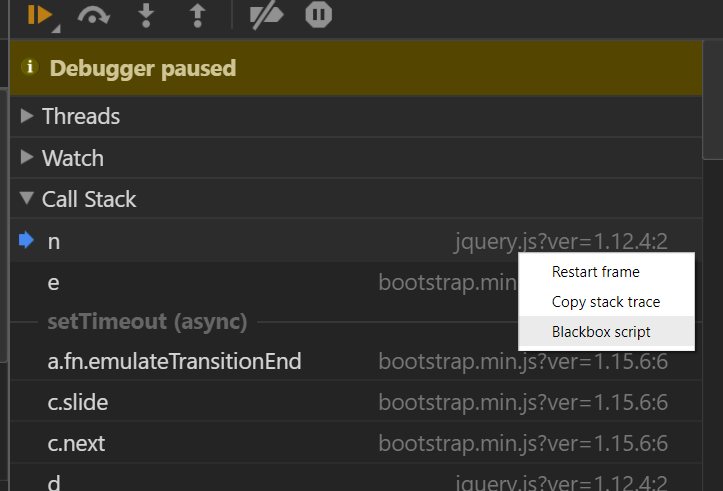
While in the debugger, right-click on the script displayed under “Call Stack”, after which we select “blackbox script”
Defining a break point
There are several ways to set a breakpoint:
1) Breakpoint on a line of JavaScript code
This breakpoint is activated when we mark the place in the code where we want to stop JS, by clicking on the sequence number of the code line in the editor, we mark where to stop the execution of the program. Read more about this on the official page
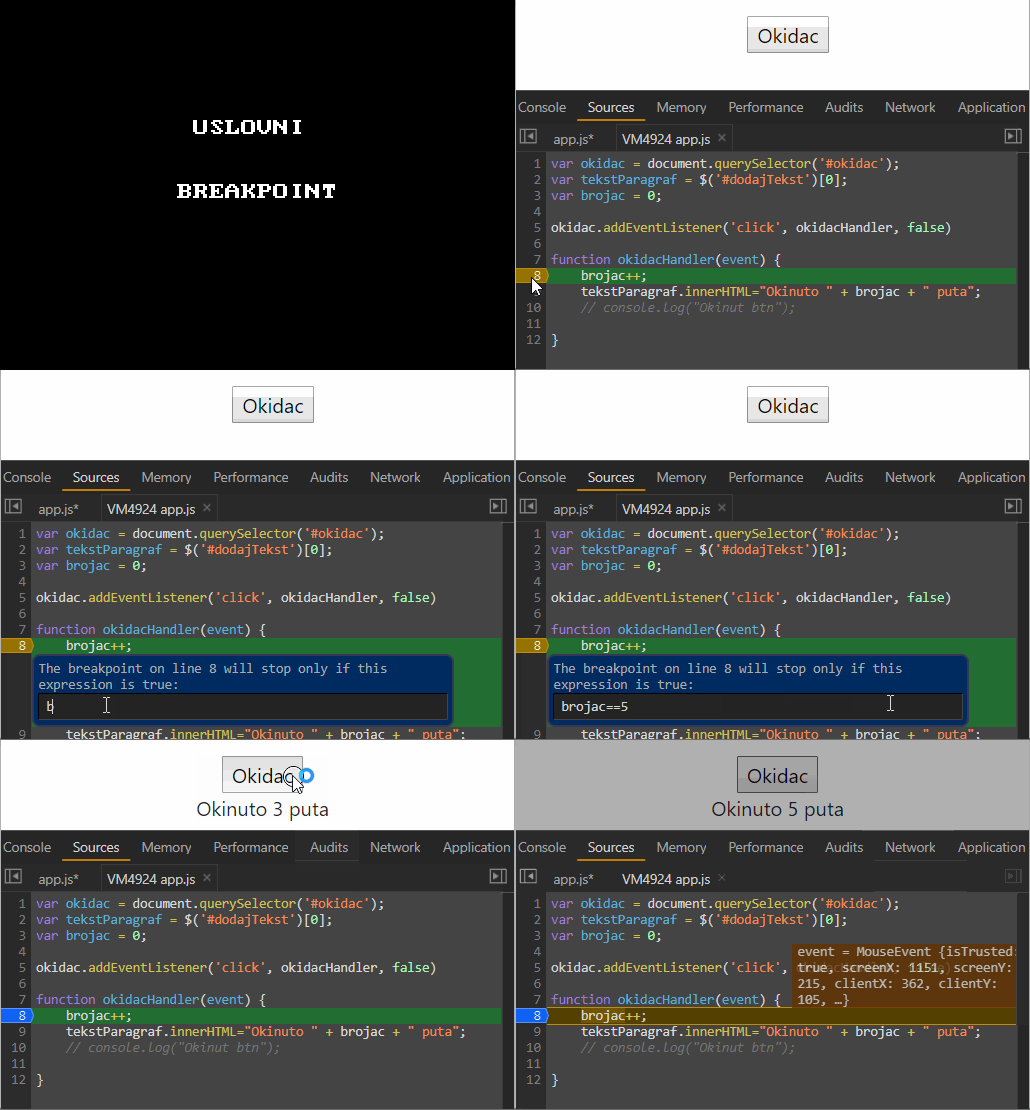
Conditional breakpoint
However, there is an option to execute a “conditional breakpoint” that depends on a given condition. Right-clicking on a break point opens a window where we can select the option “edit breakpoint”. After that, a field for entering a specific condition is displayed. A breakpoint will only fire if the condition is met. Read more about conditional breakpoints on the official page
2) Breakpoint on the DOM element
Breakpoint can be added by marking the HTML code. In order to be able to stop the execution of the program, that part of the HTML code should be connected to the JavaScript code (usually it is some dynamically generated element). This breakpoint is triggered when there is a change in the marked HTML element (and even in its children).
Right-click on the element itself, after which we select the Break on… option, and then one of the sub-options. (See image) The option “subtree modification” tracks changes overchildren of that element. (changes to child elements). If the option “attributes Modifications” is selected, then changes to the attributes of that element are tracked. While selecting the “node removal” option, the moment when the selected element is removed is monitored.
When there is a change in that HTML code, javascript execution is stopped and the JS file responsible for that change is opened, with the spot in the code responsible for that change highlighted. You can see more about this here

3) Breakpoint at XHR request
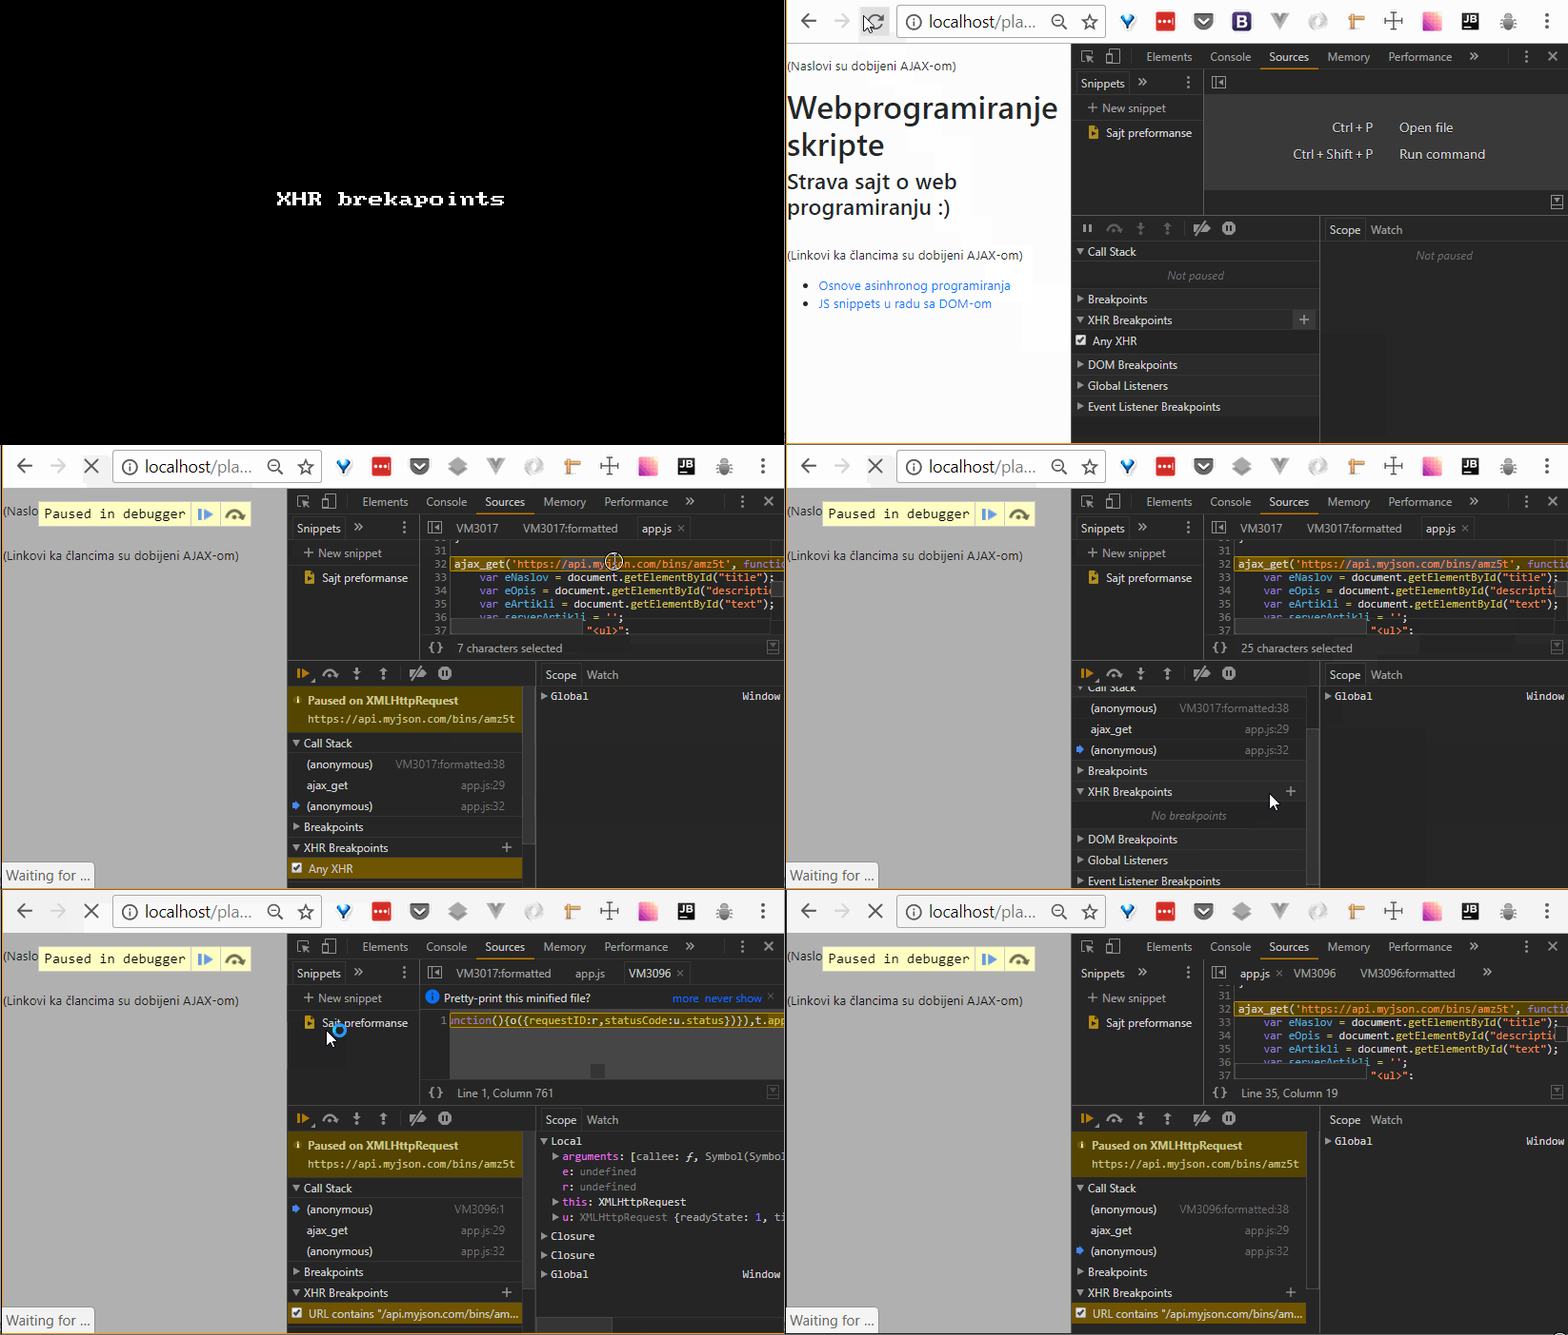
There is an option to create a breakpoint that will be activated at every ajax request. To activate such breakpoints, it is necessary to not define a condition in the section “XHR breakpoints”, after which the option “Any XHR” will appear.
It is also possible to filter breakpoints, if we define a certain string pattern for a specific XHR url address. Read more about this on the official page
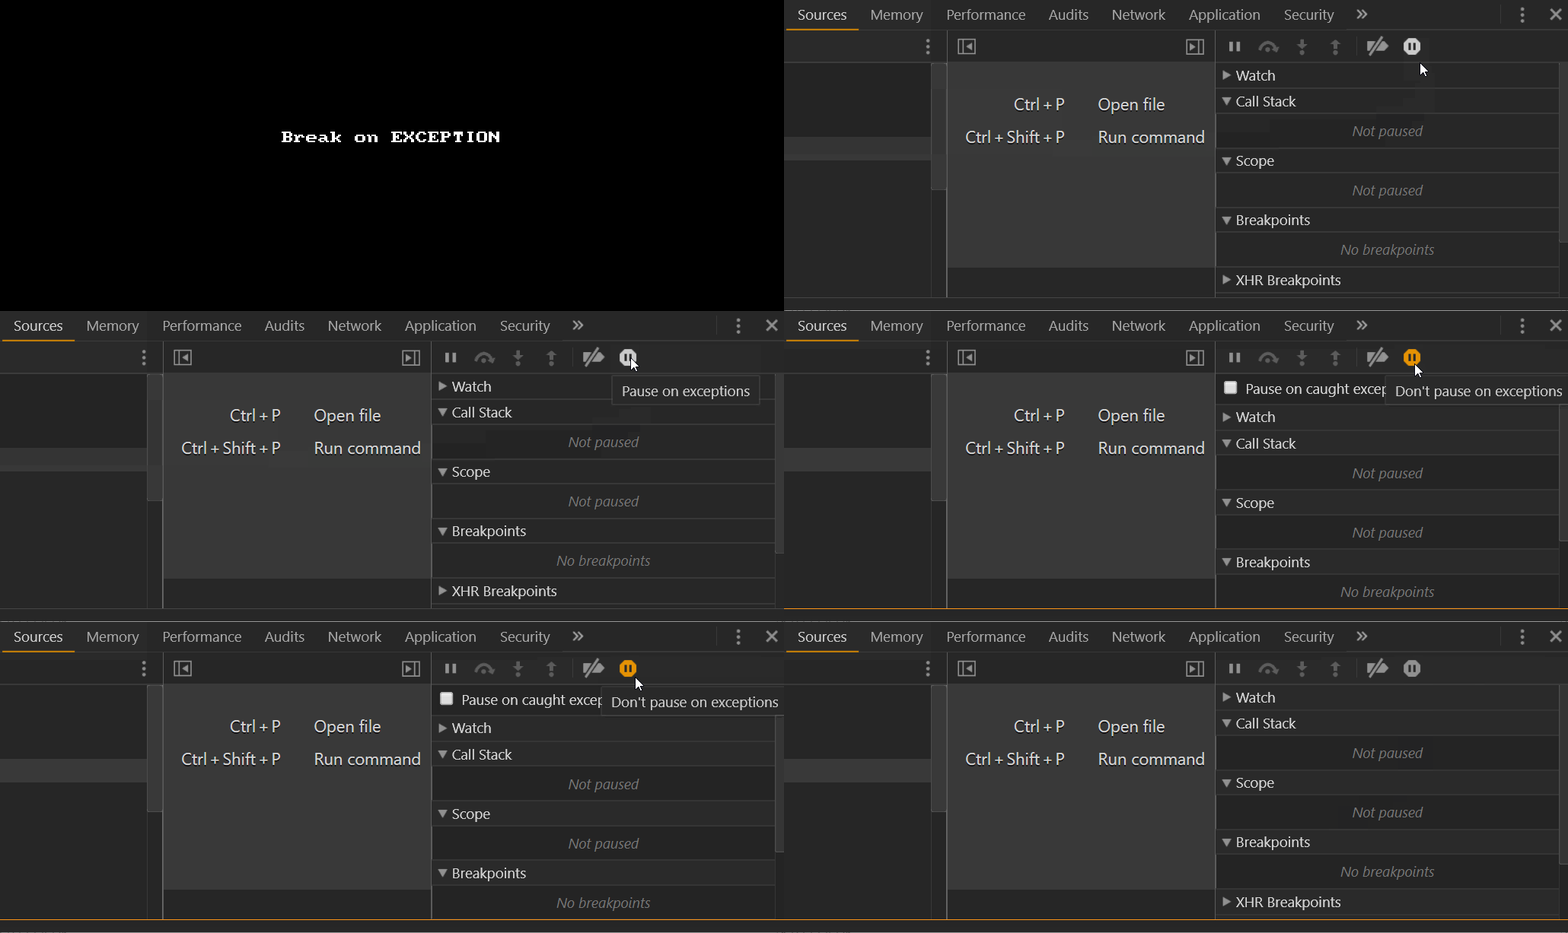
5) Breakpoint at exception
This breakpoint is triggered on the line of code that threw the exeption. Read more about this on the official page
Elements TAB
Shortcuts
| Elements Panel | Windows |
|---|---|
| Edit attribute | Enter, Double-click on attribute |
| Hide element | H |
| Toggle edit as HTML | F2 |
Event listeners for debugging events
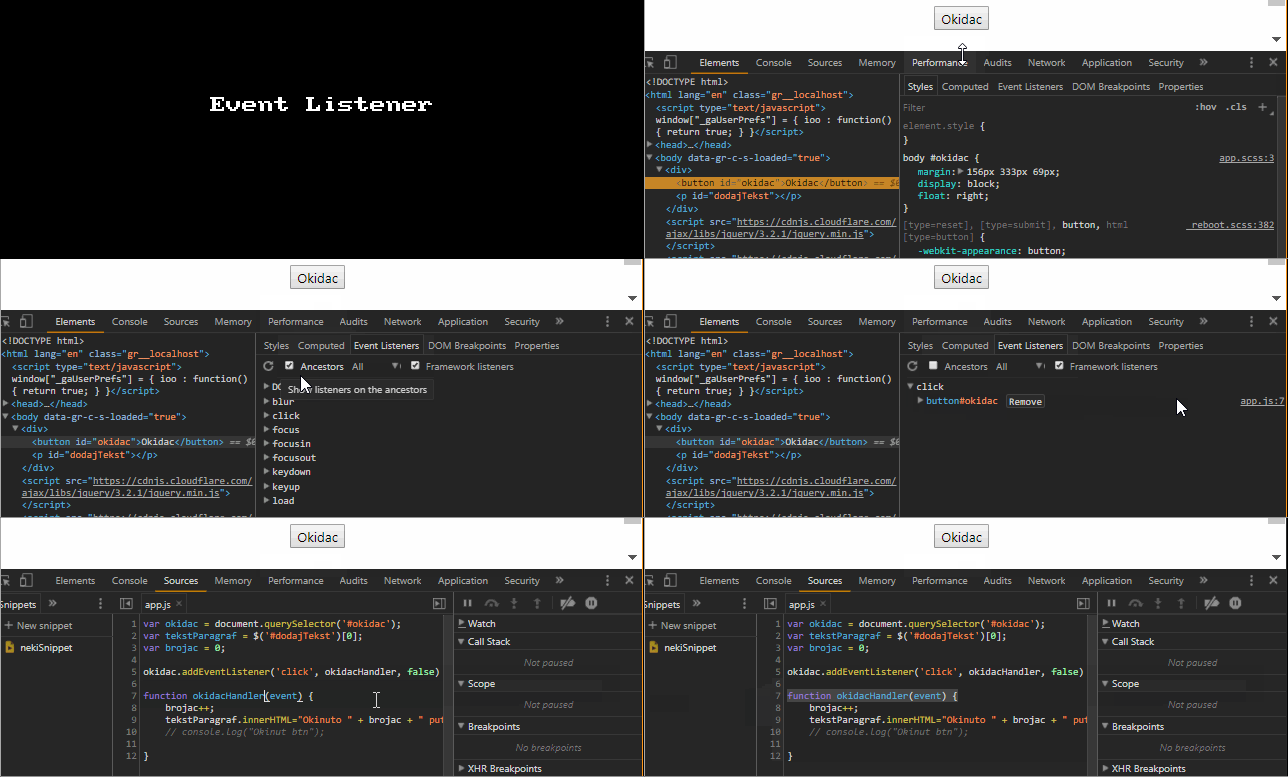
Within the Elements Panel, you can view events on an element by simply selecting the “Event listeners” tab element, while clicking on the link you can see the handler function itself.
By clicking on “remove”, we can temporarily remove the registered event handler, which is useful for quickly checking if the event handler is the cause of an unexpected error.
If your code also uses a library like jQuery, DevTools can hide the library’s event handlers and show only ours (this is not always feasible). This is achieved by selecting the checkbox “Frameworklisteners”.
Filtering CSS properties
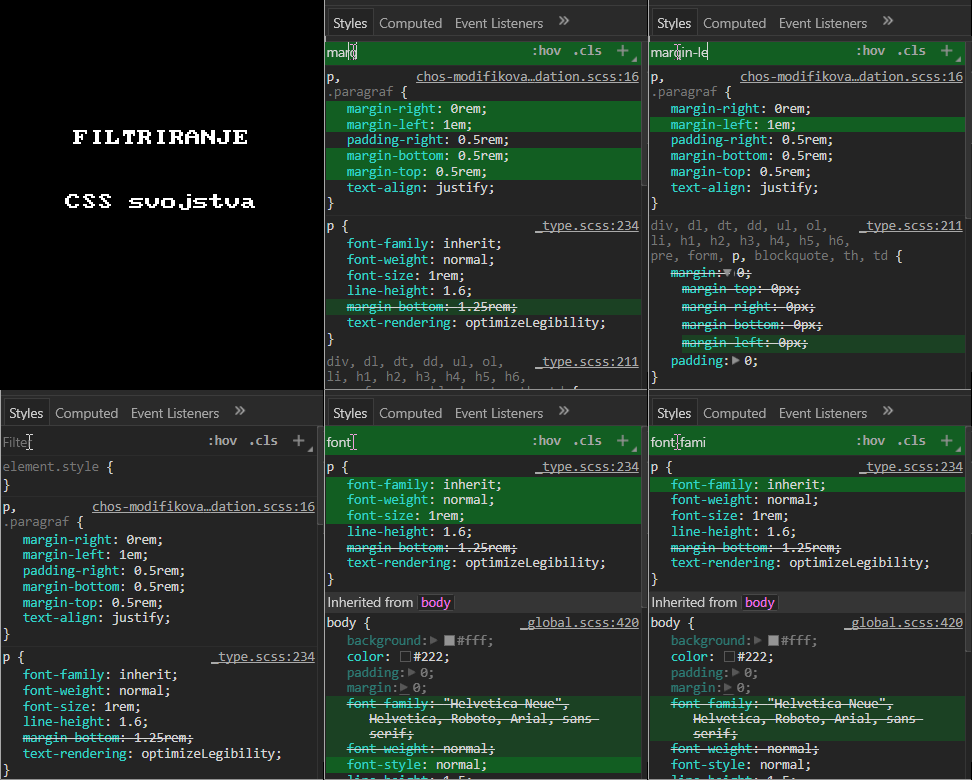
While we are in the “Styles” section, we can quickly browse the CSS properties. By simply typing the property name inside the filter input at the top of the section (see image). Immediately after entering the filter, the filtered properties are highlighted, activated with a slightly stronger color.
Console TAB
Shortcuts
| Console & Editor section | Windows |
|---|---|
| Open the Console panel | Control+Shift+J |
| Selecting the same words | CTRL + D |
| Delete Consle | CTRL + L |
| Toggle edit as HTML | F2 |
Console logging levels
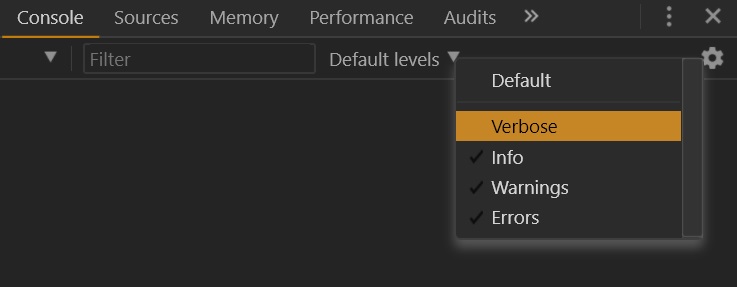
Choosing the content we want to see in the console is done in the logging levels drop-down menu. This drop-down menu is located at the top of the console to the right of the filter. Attention is drawn to the Verbose option, which is the “broadest” option and even displays a textual description of certain problems.
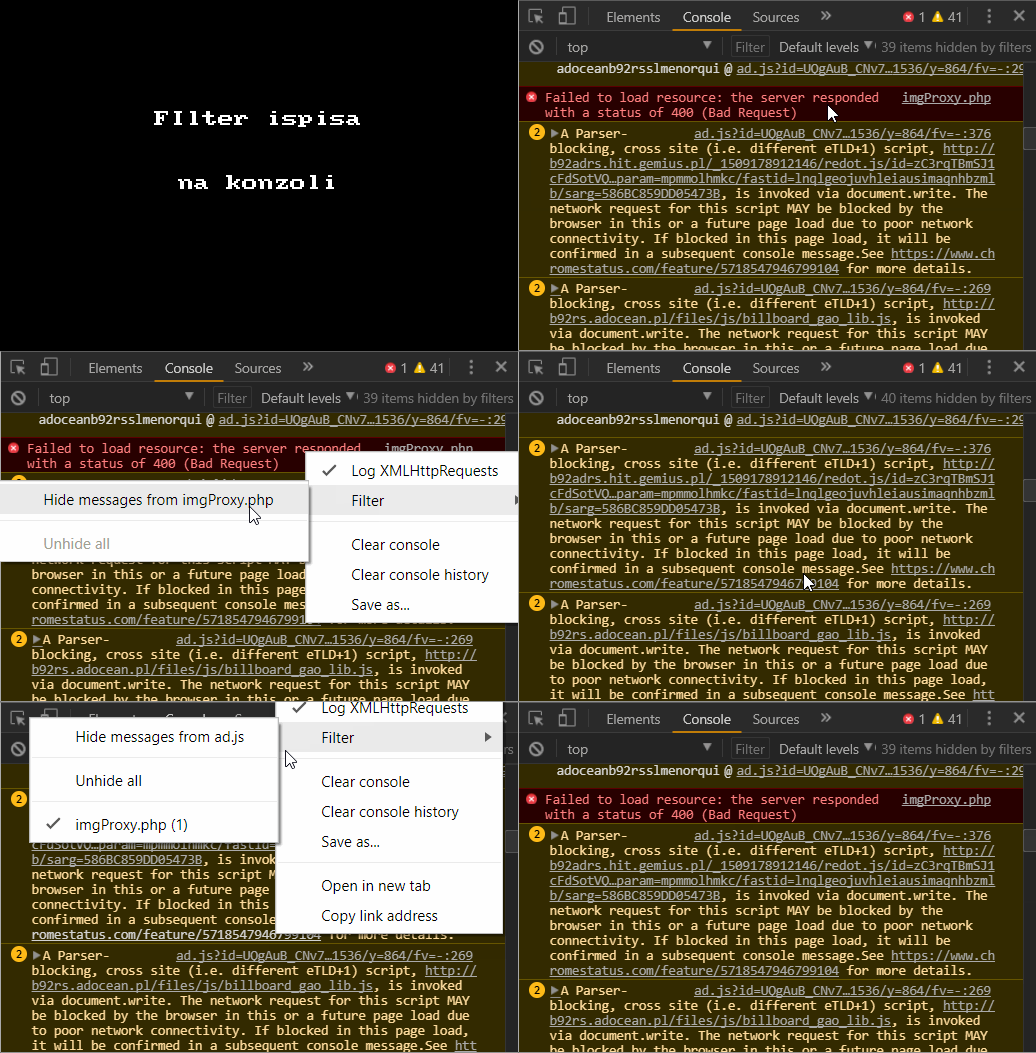
Filtering console reports
If there are errors or warnings in the console from “third party” sources that you cannot influence and therefore you are not interested in reports about them, you can filter them. The selection of the filtering option is obtained by right-clicking on the report in the console. After that, we get a section where the report filter option that we clicked on appears.
If after some time we still want to see all the reports, it is enough to select the filter section again with a right click, after checking it is necessary to select “unhide all”.
Printing in the console
consoloe.log()
The most common way to print without any formatting:
|
1 2 3 4 5 6 7 8 9 10 11 12 13 14 |
var animals = [ { animal: 'Horse', name: 'Henry', age: 43 }, { animal: 'Dog', name: 'Fred', age: 13 }, { animal: 'Cat', name: 'Frodo', age: 18 } ]; console.log(animals); // Outputna konzoli: (3) [{…}, {…}, {…}] 0 : {animal: "Horse", name: "Henry", age: 43} 1 : {animal: "Dog", name: "Fred", age: 13} 2 : {animal: "Cat", name: "Frodo", age: 18} length : 3 __proto__ : Array(0) |
console.table()
|
1 |
console.table(); |
Example
|
1 2 3 4 5 6 |
var animals = [ { animal: 'Horse', name: 'Henry', age: 43 }, { animal: 'Dog', name: 'Fred', age: 13 }, { animal: 'Cat', name: 'Frodo', age: 18 } ]; console.table(animals); |
This method prints an overview object with all properties:

However, if the object has a lot of properties, the table can be overwhelming, then it is good to choose the columns that interest us. The selection of properties that we want to display is defined through the second argument:
|
1 |
console.table(animals, ["name", "age"]); |
console.dir()
Prints the desired directory-style object:
|
1 2 3 4 5 6 7 8 9 10 11 12 13 14 15 |
var animals = [ { animal: 'Horse', name: 'Henry', age: 43 }, { animal: 'Dog', name: 'Fred', age: 13 }, { animal: 'Cat', name: 'Frodo', age: 18 } ]; console.dir(animals); // Exit Array(3) 0 : {animal: "Horse", name: "Henry", age: 43} 1 : {animal: "Dog", name: "Fred", age: 13} 2 : {animal: "Cat", name: "Frodo", age: 18} 2 : {animal: "Cat", name: "Frodo", age: 18} length : 3 __proto__ : Array(0) |
console.trace()
The
Console.trace() statement is placed inside the code, and in the console it prints the entire call Stack that called that code.
|
1 |
console.trace('The name of the trace for recognition'); |
Example
In this example, the console.trace() function is placed inside the sumFunction() function, so it will print the creo call stack that called the sumFunction() function in the console:
|
1 2 3 4 5 6 7 8 9 10 11 12 13 |
function app(){ function doSomething(){ var a = 1; var b = 2; console.log( sumFunction(a, b) ); } function sumFunction(a, b){ console.trace("The name for the trace that is in sumFunction"); return a + b; } doSomething(); } app(); |
The functions are printed in the console according to the reverse order of calling, and next to each function is a link to it:
|
1 2 3 4 5 |
Naziv za trace koji je u sumFunction sumFunction @ VM566:8 doSomething @ VM566:5 app @ VM566:11 (anonymous) @ VM566:13 |
console.error()
Prints a message just like console.log(), except that it is formatted as error
|
1 |
console.error('error: name is undefined'); |
console.assert()
A function that throws an error if a certain condition is not met:
|
1 2 3 4 |
function greaterThan(a,b) { console.assert(a > b, {"message":"a is not greater than b","a":a,"b":b}); } greaterThan(5,6); |
console.time()
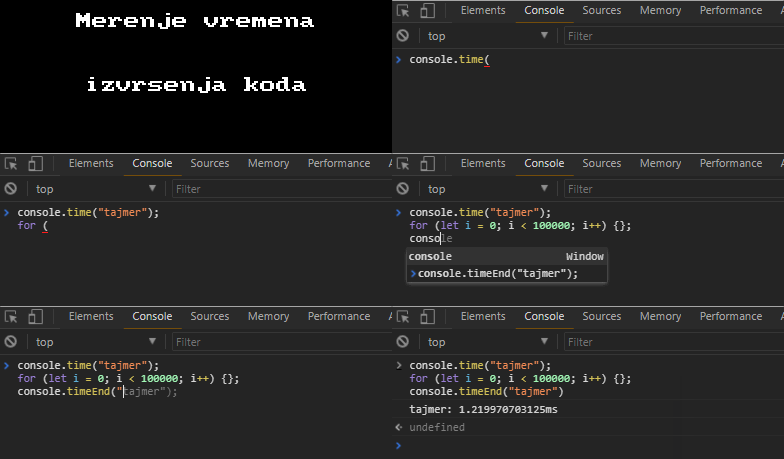
This function is used to measure the execution time of a piece of code. It is necessary to add:
before the beginning of the code
cosnole.time(‘someTimerName’)
this is followed by where we measure the execution time, and after it:
console.timeEnd(‘someTimerName’)
Monitoring events from the console
monitorEvents()
The monitorEvents() method returns data about the element targeted with the event.
|
1 |
monitorEvents(objekat, "tipDogadjaja") |
Example
|
1 |
monitorEvents(document.body, "click"); |
Or even:
|
1 |
monitorEvents(document.getElementById("interactive"), ["mouse", "keyup", "keydown"]) |
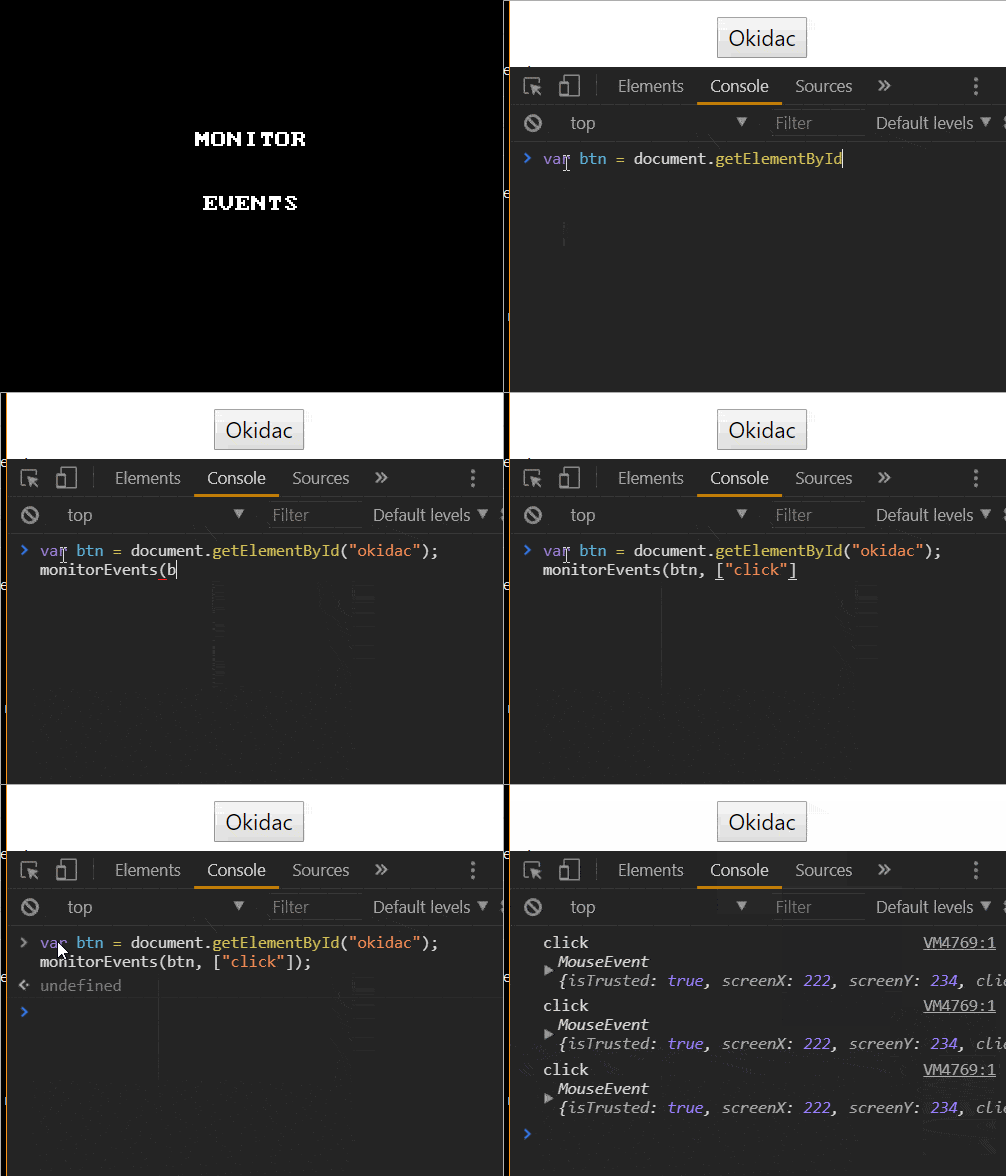
To stop monitoring, use the command:
|
1 |
unmonitorEvents(nazivElementa) |
Feature monitor
If we want to monitor the calling of a certain function, we use the method
monitor(nazivFunkcije). This method prints to the console every time the function is called and what arguments are passed to it.
E.g.
function nazivFunkcije called with arguments: [object MouseEvent] // funkcija je event handler
To stop monitoring, use the command:
|
1 |
unmonitor(nazivFunkcije) |
Source TAB
Shortcuts
| Sources Panel | Windows |
|---|---|
| Pause / resume script execution | F8, Ctrl + |
| Step over next function call | F10, Ctrl + ' |
| Step into next function call | F11, Ctrl + ; |
| Step out of current function | Shift + F11, Ctrl + Shift + ; |
| Select next call frame | Ctrl + . |
| Select previous call frame | Ctrl + , |
| Toggle breakpoint condition | Click on line number, Ctrl + B |
| Edit breakpoint condition | Right-click on line number |
| Delete individual words | Ctrl + Delete |
| Comment a line or selected text | Ctrl + / |
| Save changes to local modifications | Ctrl + S |
| Save all changes | Ctrl + Alt + S |
| Go to line | Ctrl + G |
| Search by filename | Ctrl + O |
| Search functions within a file opened in the editor | Ctrl + Shift + O |
| Jump to line number | Ctrl + P + :number |
| Jump to column | Ctrl + O + :number + :number |
| Go to member | |
| Close active tab | Alt + W |
| Run snippet | Ctrl + Enter |
This TAB consists of three sections: Source/Snippets section, Editor section and Debugging section.
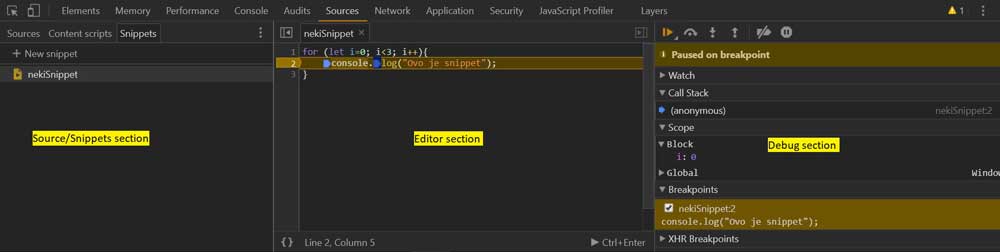
a) Source – “Snippets section”
Add local source files to workspace
“Add local source files to workspace” actually means that direct access to local files from the browser itself is enabled. Connection is possible for JS and stylesheet files, while for DOM i.e. HTML file is not applicable. In order to connect the files from the “sources” tab inside Chrome DevTools with local files and thus save the changes to the JS files even after reloading the browser, you need to do the following two steps:
-
Add Folder to Workspace
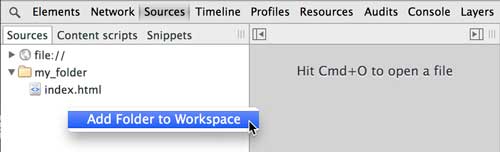
The following procedure tells the browser where our local folder with files is located.
- Right-click in the left-side panel.
- Select Add Folder to Workspace. An alternative to this procedure is to drag and drop a folder from the explorer to the inspector
- Choose location of local folder that you want to map.
- Click Allow to give Chrome access to the folder.
-
Map to File System Resource
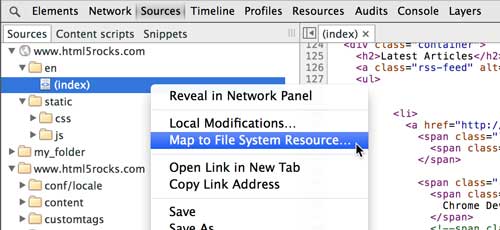
The second part of the procedure is related to files individually. Using the following procedure, we connect a certain file with the browser. After that, all files can be modified from the source panel, and even css files directly from the Elements/Styles panel.- Right-click or Control+click on a file in the Sources left-side panel.
- Choose Map to File System Resource.
- Select the local file in the persistent workspace.
- Reload the page in Chrome.
NOTE:
Files with .scss extension cannot be edited from the Elements/Styles panel, only css!
In order to save the changes made in the browser within the Sources panel, after right-clicking, select the Save option.
In addition to this functionality, new files can be created from the workspace, old files can be deleted, and backup copies of files can be made directly on the hard disk.
NOTE:
This whole procedure will allow local files on the disk to be changed from the browser, so if you want to save the current state, MAKE A COPYFILE BEFORE CHANGE!
Snippet in browser
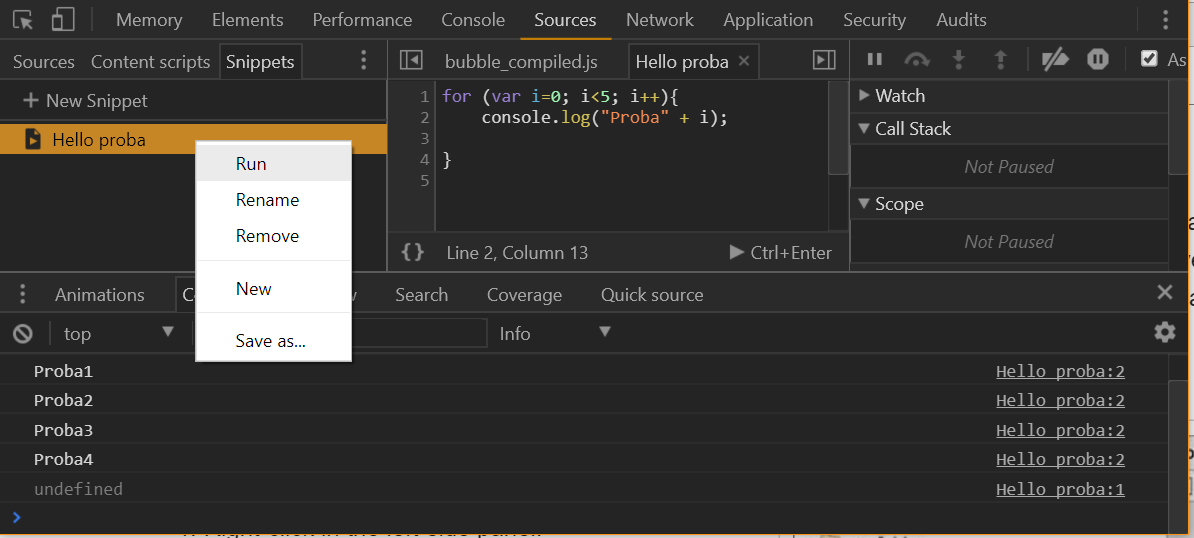
As part of Chrome DevTools, part of the code can be saved even after refreshing the page. Saved code as snippets can be run independently while we are on any page.
Online snippets database
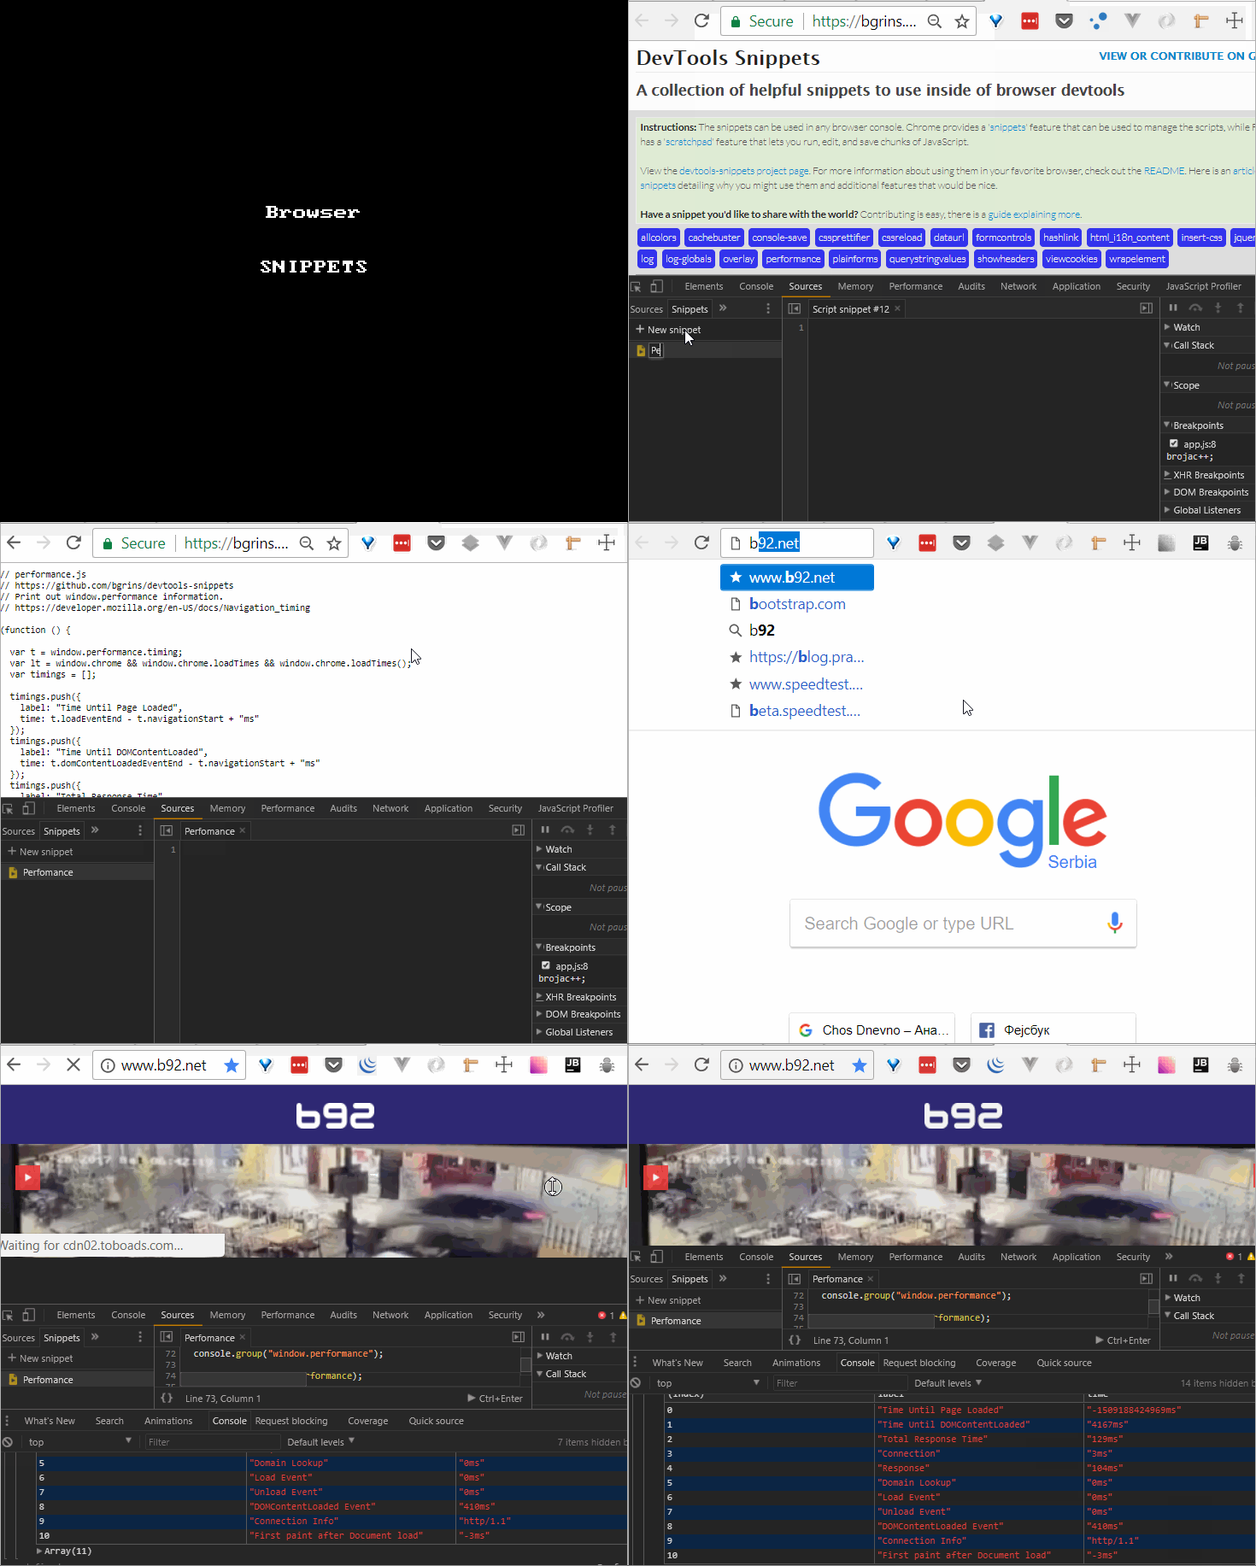
You can find a database of useful snippets at https://bgrins.github.io/devtools-snippets/. If we save some of the prepared snippets, we can later run them on any page. One of the useful snippets is related to web application performance review:
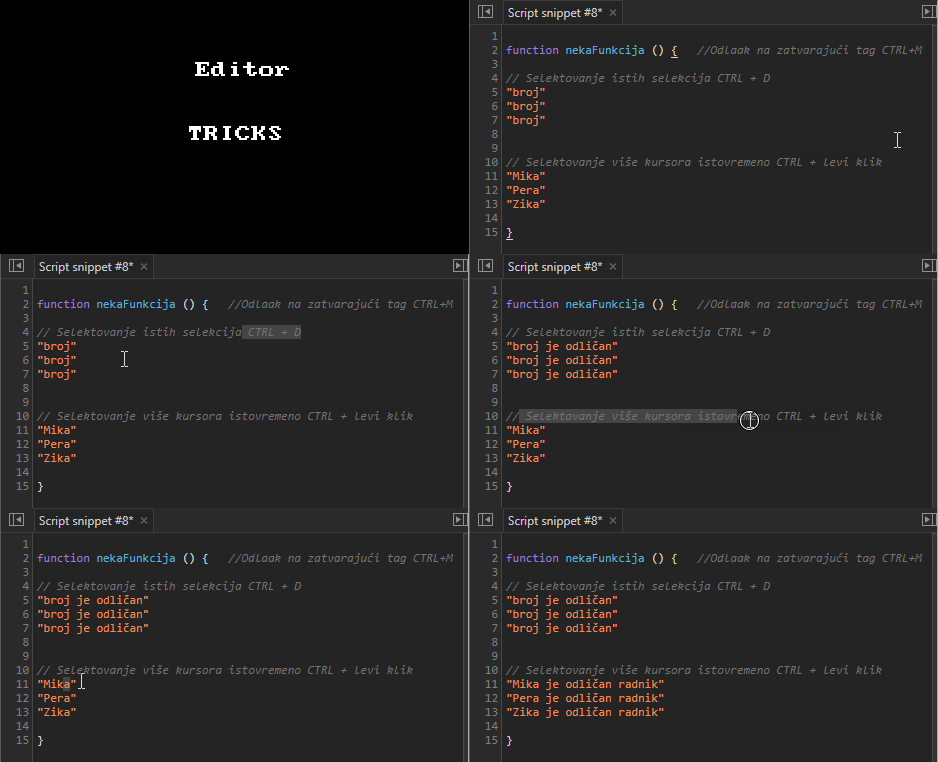
b) Source – “Editor section”
Placing the cursor in multiple places at once with CTRL + left mouse click. Multiple selection of the same content with CTRL + D. Go to the closing or opening tag with CTRL + M.
c) Source – “Debugging section”
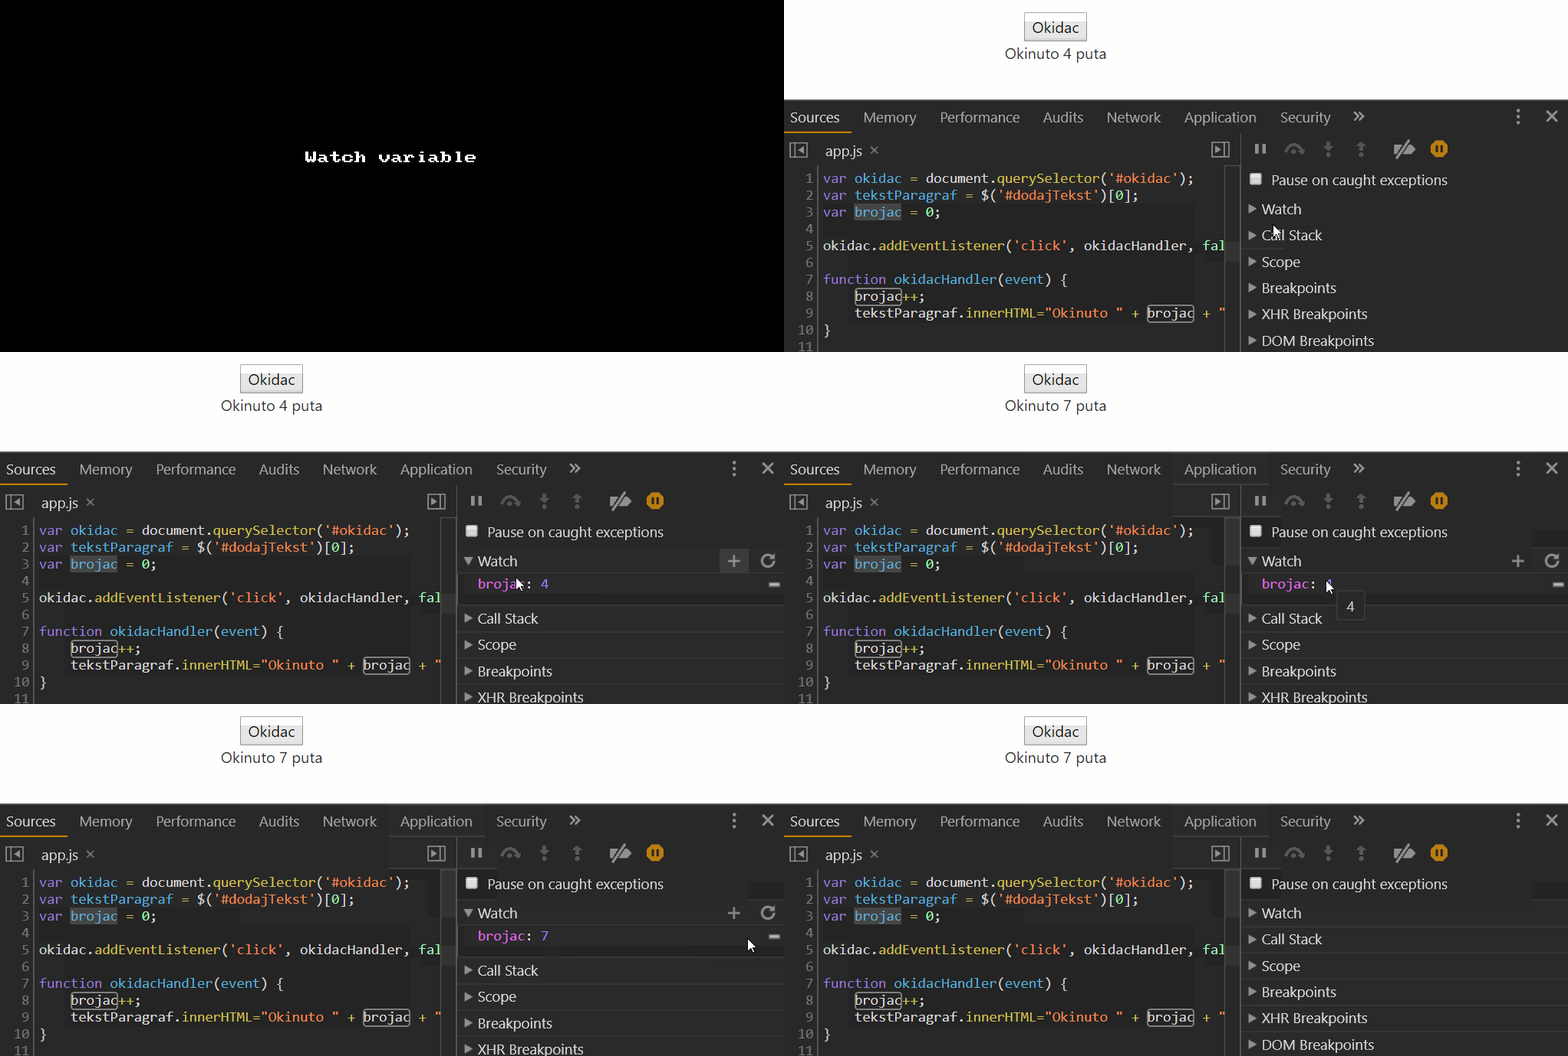
a) Watch expression (Monitoring the value of an expression)
b) Call Stack
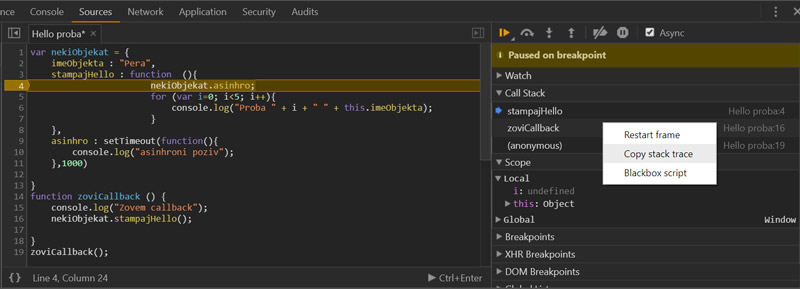
Call Stack is a section that shows how the currently stopped line was reached during debugging, which functions were called until then. If we expect to monitor asynchronous calls, we need to check the Async input. By right-clicking on the Call Stack section, we open a dropdown where we can choose:
- Restart Frame – restarting the code and all values just before the breakpoint
- Copy Stack trace – we copy the entire Stack that is at that moment
- Blackbox script – another way to tell Chrom DevTools which files not to check
c) Scope of variables
While the program is paused on a line of code, in the “Scope” part, you can view the current variables in the local, global and closure scope (domain).

d) Breakpoints
All breakpoints are shown in this section.
e) XHR Breakpoints
In this part, existing breakpoints related to AJAX requests are defined and reviewed. If there is an AJAX request with the specified url address, the browser will stop the execution of the program when the request is sent. We can create breakpoints on every AJAX request if we create a new breakpoint but leave the field where the url address is entered empty.
d) DOM Breakpoints
This section shows all breakpointsdefined on the DOM.
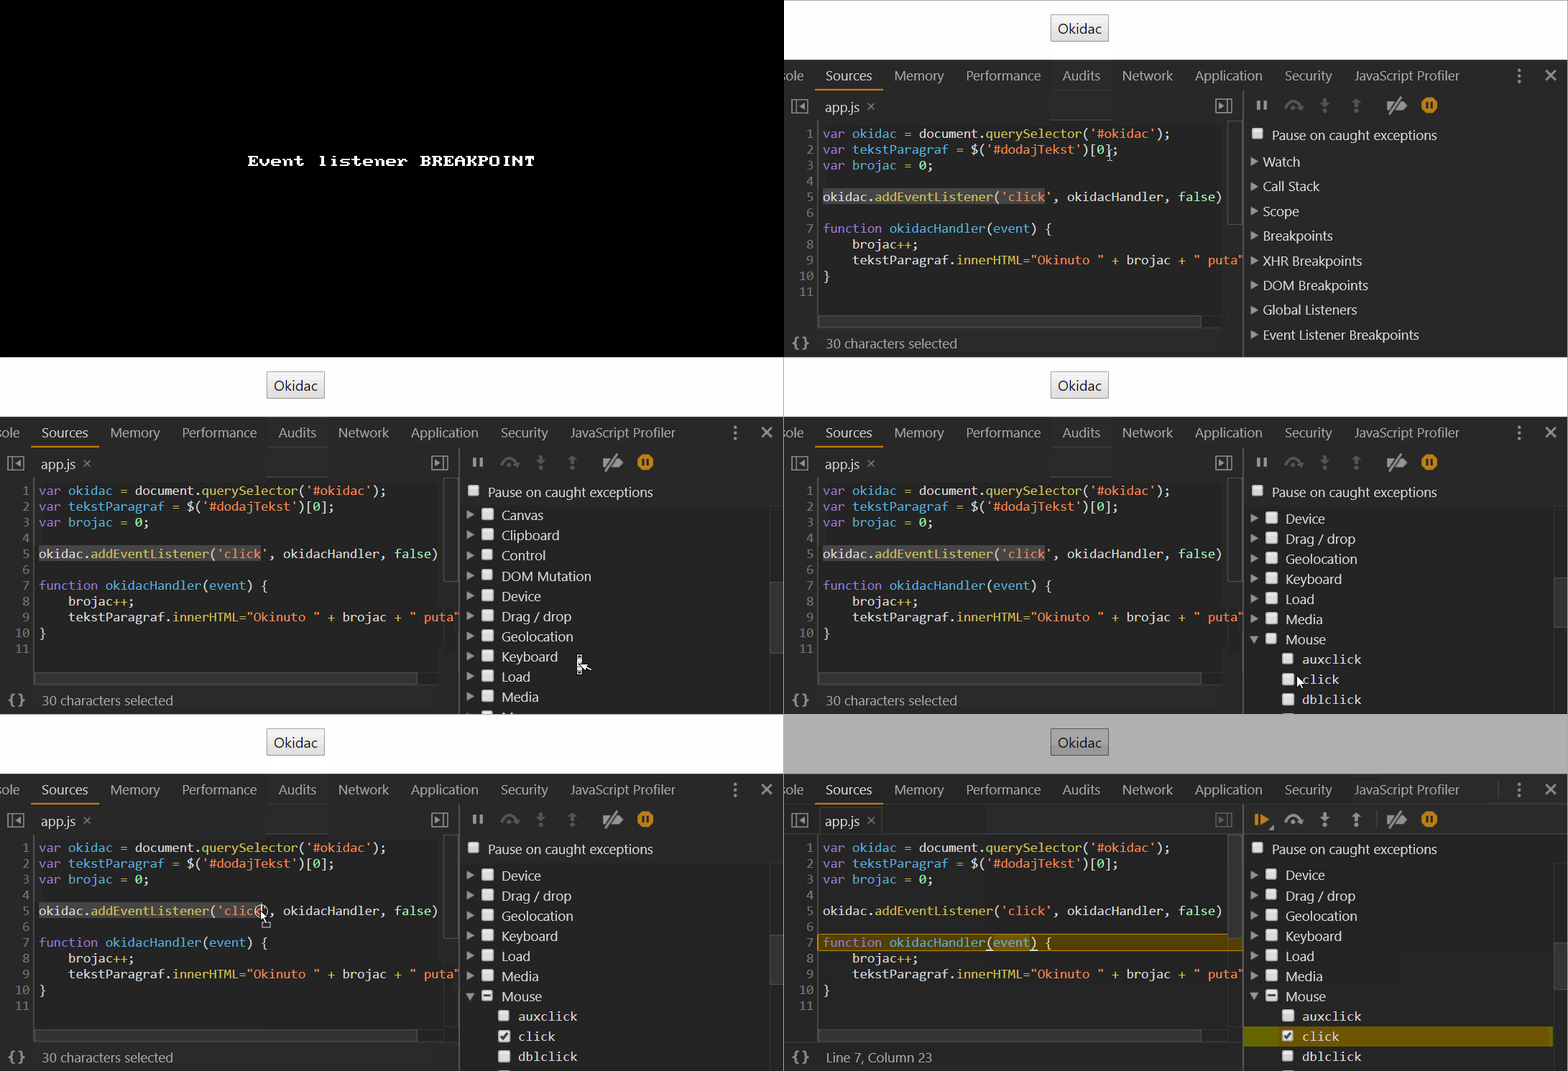
f) Event Listener breakpoint
In this part, all possible events are listed, we only need to indicate which type of event we want to create a breakpoint. This breakpoint is activated in the part of the code where there is an event listener that should be executed immediately after the event.
Network Tab
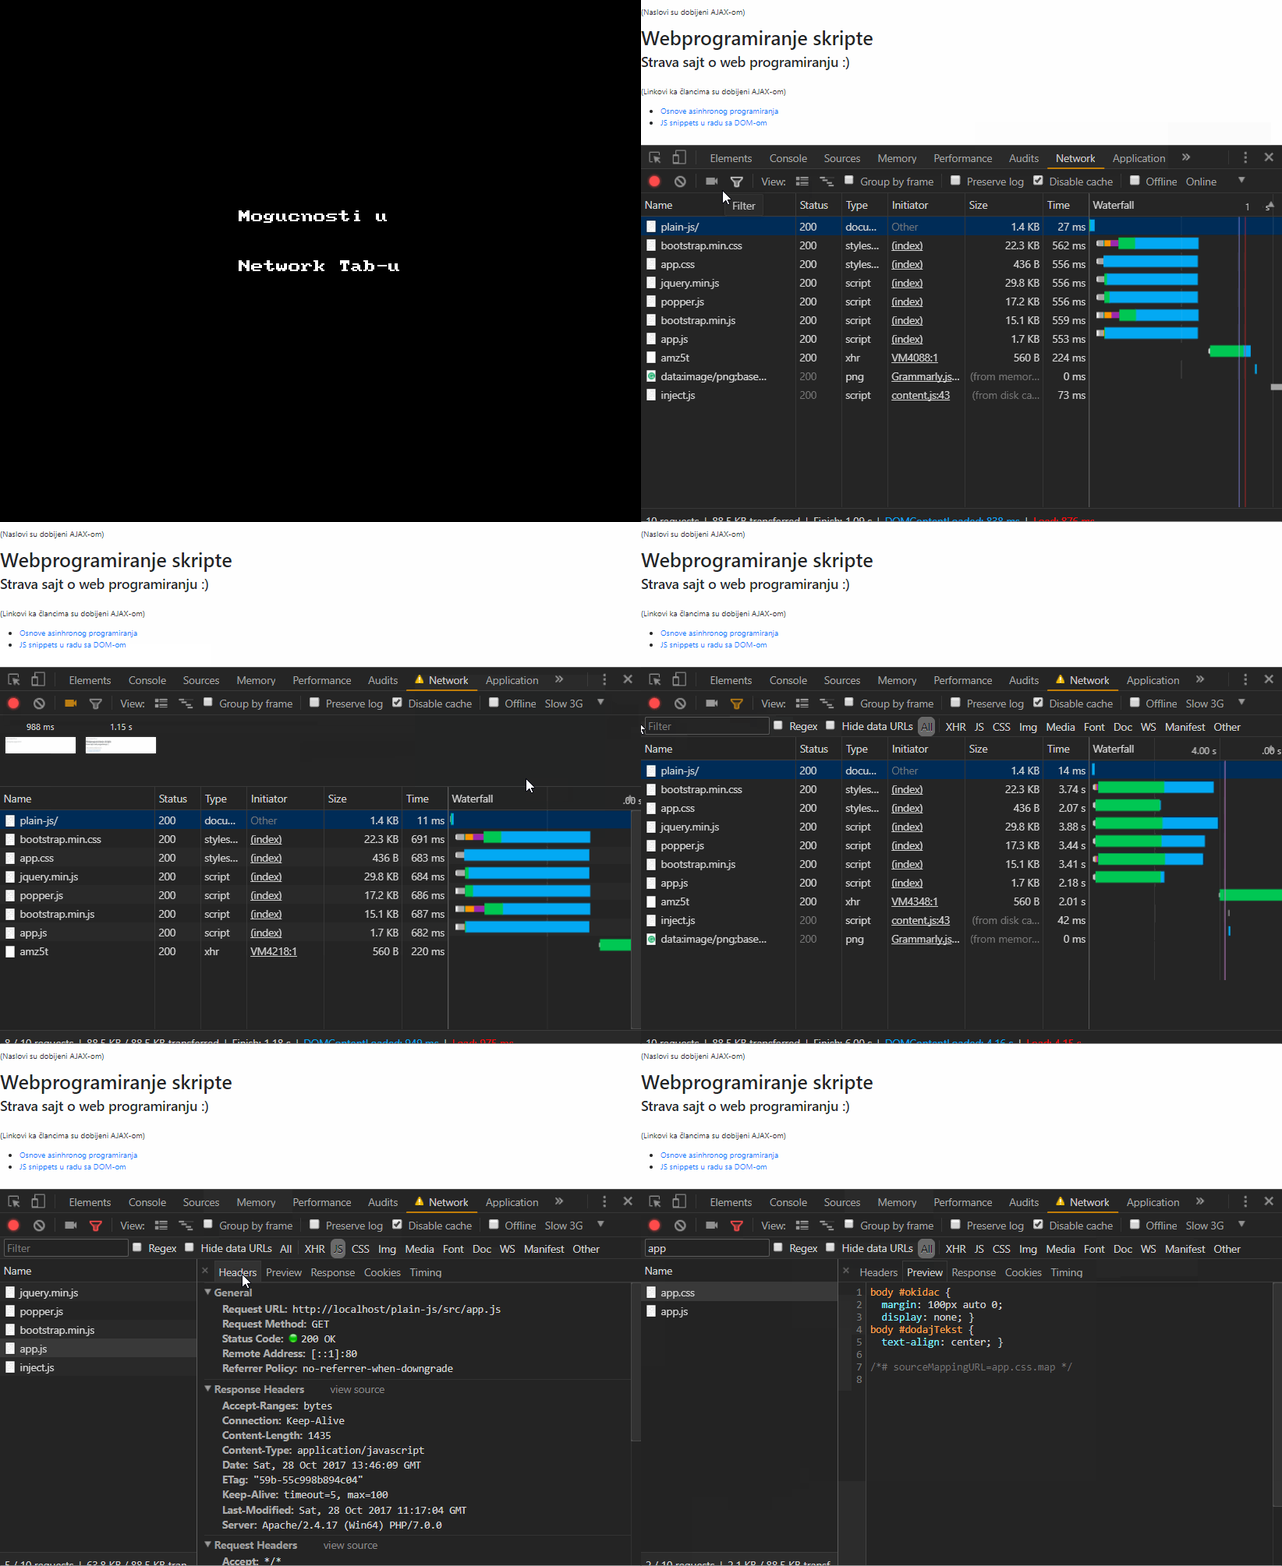
The Network tab deals with the loading time and order of all files coming from the network. After loading the page, all the files that arrived are printed, as well as details about them: headers, loading time. We can see the so-called “waterfall” display, as well as capture filmstrip over time. By learning some of the filtering options, we can simply choose which file we are interested in. There is a possibility of imitating some other type of network (eg 3G, 2G…) and the results that would be obtained if those networks were selected.
Tips & Tricks
Editing content from the browser
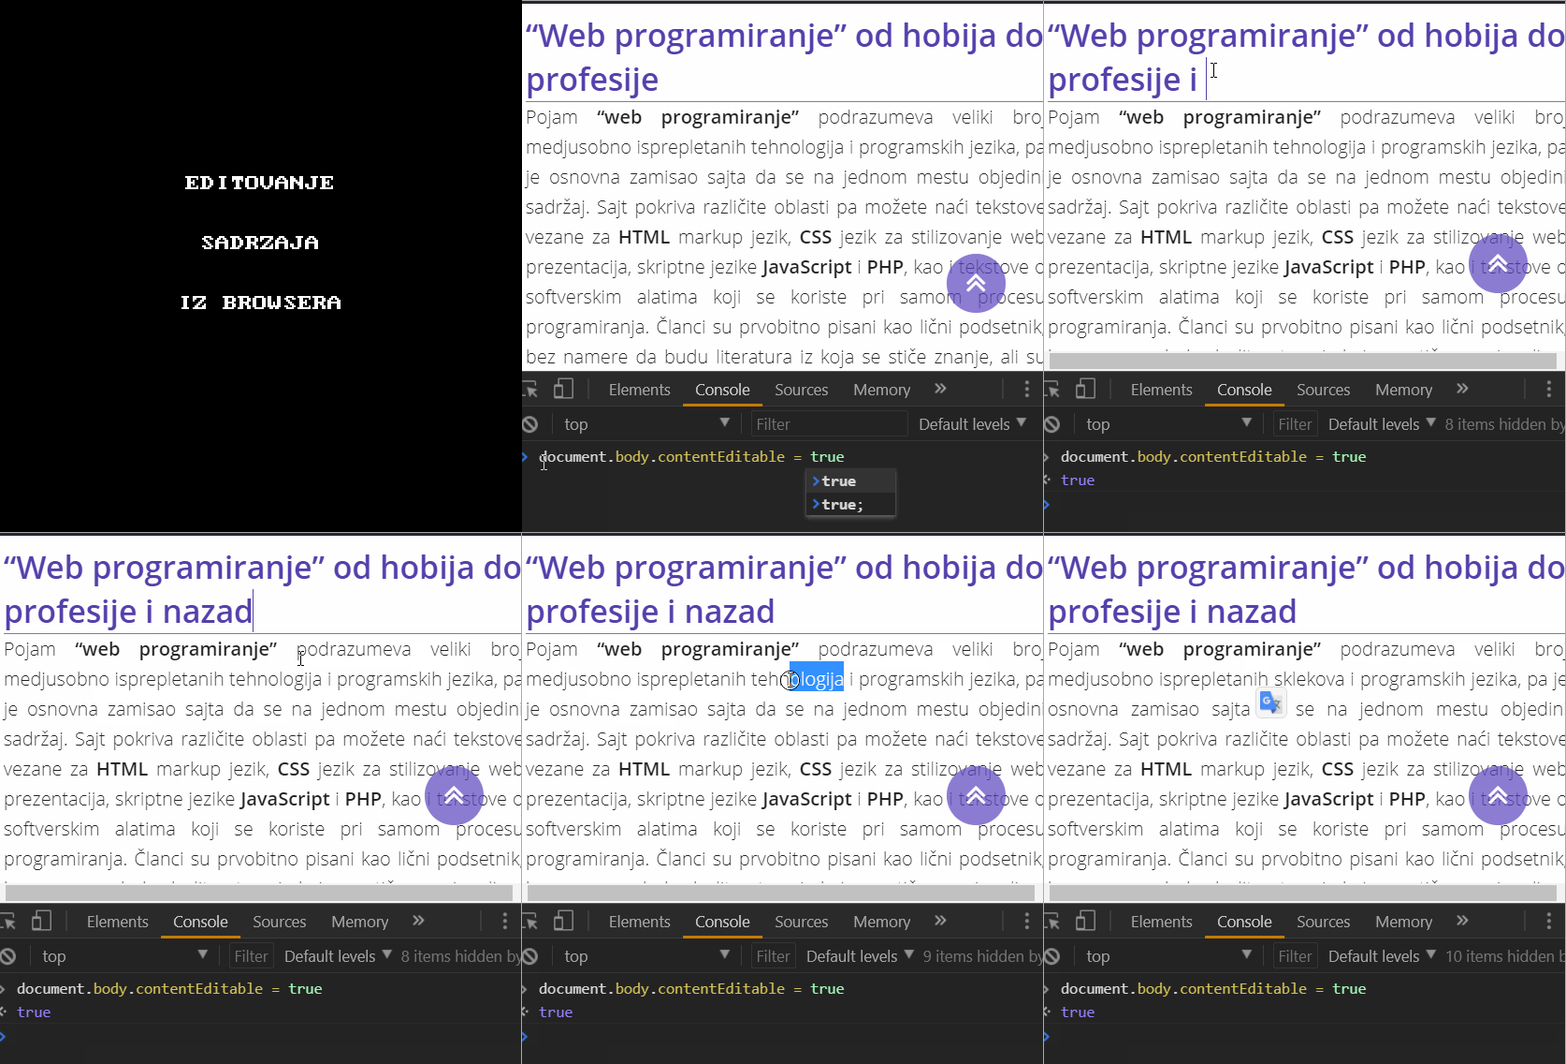
By adding the attribute contenteditable="true" to any HTML element, that element becomes editable from the browser itself. In order to “quickly” try out the content, we can add an attribute through the elements tab or even the koros console:
document.body.contenteditable = true